Monitoring Scheduled Reports and Exports
Scheduled reports power business decisions. When these jobs fail, stakeholders make decisions based on stale data. Here's how to monitor report generation.

Monitoring Scheduled Reports and Exports
Scheduled reports power business decisions across organizations. Executives check their daily dashboards, finance reconciles transactions with automated exports, and operations teams track KPIs through generated reports. When these jobs fail, stakeholders often do not know. Studies suggest that over 60% of scheduled job failures go undetected until someone manually notices a missing report. Teams make decisions based on stale data or waste time hunting for reports that never arrived. This guide covers how to monitor report generation jobs so your team always has the data they need.
Common Scheduled Report Jobs
Most organizations run several types of scheduled report jobs:
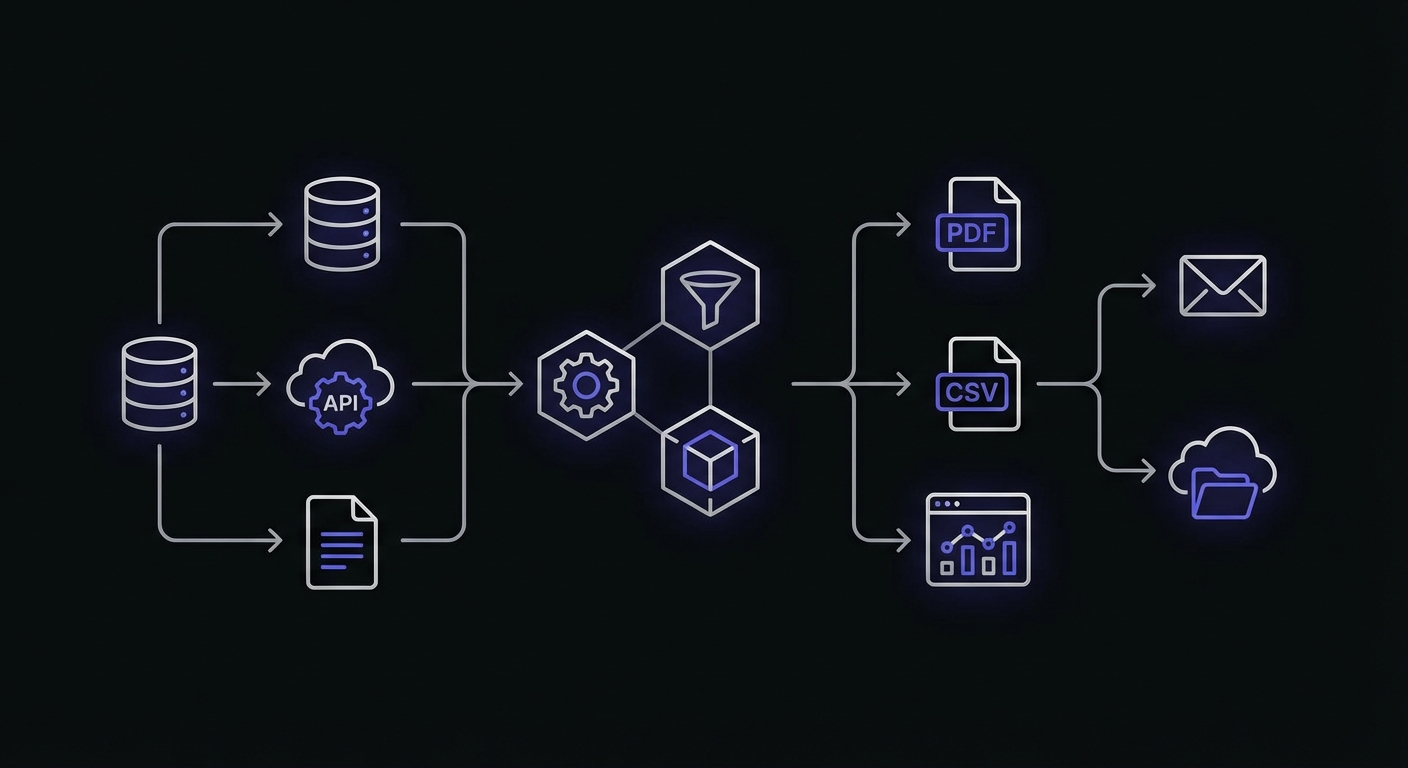
Daily and weekly analytics reports: Summaries of key metrics sent to stakeholders each morning. Sales numbers, user activity, conversion rates, and operational statistics.
Customer data exports: Automated exports for CRM systems, marketing platforms, or data warehouses. These feed downstream processes that depend on fresh data.
Financial reconciliation reports: Transaction summaries, payment reconciliation, and accounting exports. Often required for compliance and financial close processes.
Inventory reports: Stock levels, reorder alerts, and warehouse status for operations teams. Critical for businesses with physical goods.
Usage and billing reports: For SaaS companies, reports tracking customer usage that feed into billing calculations or customer success outreach.
Executive dashboards: High-level summaries prepared for leadership. Often the most visible reports when they fail to arrive.
Report Automation Types
Different report patterns require different monitoring approaches:
| Report Type | Trigger | Monitoring Approach |
|---|---|---|
| Scheduled | Time-based (cron) | Heartbeat check at expected completion |
| On-demand | User request | Timeout monitoring, queue depth tracking |
| Trigger-based | Event (threshold, record added) | Execution confirmation within expected window |
| Batch | End-of-period processing | Duration tracking, resource monitoring |
| Real-time | Continuous stream | Heartbeat at regular intervals |
| Embedded | Application-integrated | API response monitoring |
Scheduled reports are the most common type for small teams. They run at fixed intervals and benefit from straightforward heartbeat monitoring. Trigger-based reports need more sophisticated monitoring since their execution timing is unpredictable.
Why Report Jobs Fail
Report jobs fail for reasons distinct from other scheduled tasks:
Data source unavailable: The database, API, or data warehouse the report queries is down, slow, or unreachable. The job cannot retrieve the data it needs.
Query timeout: Reports that aggregate large amounts of data can hit database query timeouts, especially as data grows over time.
Memory exhaustion: Building large reports in memory before writing to file can exceed available memory, causing the process to crash.
Disk space for exports: Large exports need disk space. If the disk fills up, the export fails partway through.
Email delivery failure: The report generates successfully but fails to send. Stakeholders never receive it. Email delivery issues affect more than just reports. See our email queue monitoring guide for comprehensive coverage.
API rate limits: Reports that aggregate data from external APIs can hit rate limits, causing incomplete data or outright failures.
Each failure mode has different symptoms. A data source timeout looks like a hang. Memory exhaustion is a crash. Email failure means the report exists but nobody knows.
Impact of Missed Reports
The consequences of missed reports extend beyond technical concerns:
Stakeholders do not know: Unlike a customer-facing feature, a missing report often goes unnoticed initially. The person expecting the report might assume it is delayed, or simply forget to check.
Decisions made on stale data: If yesterday's report did not generate but the previous day's report is still accessible, stakeholders might not realize they are looking at old data.
Compliance issues: Financial and regulatory reports have deadlines. Missed reports can trigger compliance violations. For SaaS companies with compliance requirements, see our SaaS cron monitoring guide for additional considerations.
Manual work to regenerate: When someone finally notices the missing report, you have to manually trigger generation. This pulls you away from other work and may require debugging why the scheduled job failed.
Monitoring Strategy for Reports
Effective report monitoring addresses both generation and delivery:
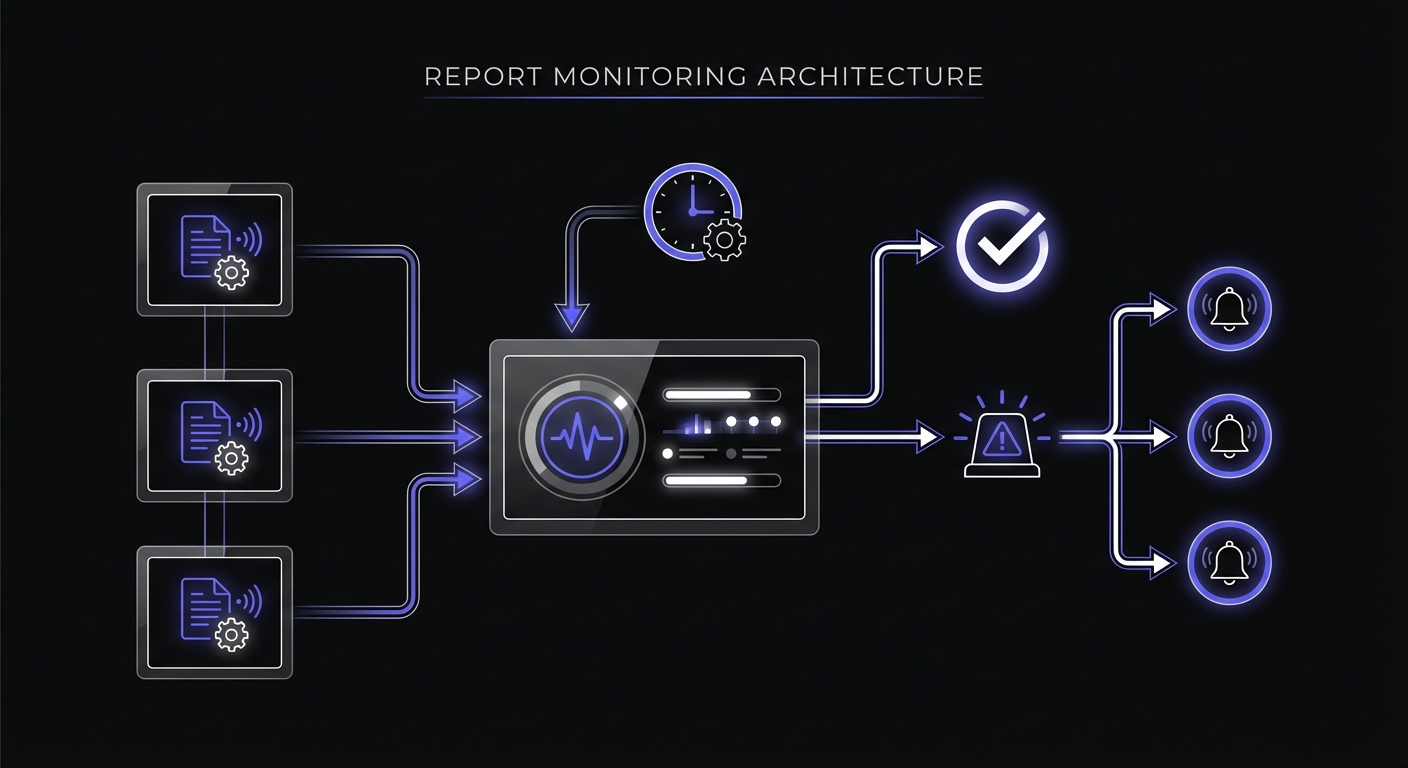
Monitor the generation job: This is the primary monitor. Did the job run? Did it complete successfully?
Monitor the delivery job separately: If report generation and delivery are separate steps, monitor each independently. A report that generates but fails to send is still a failure from the stakeholder perspective.
Track duration: Reports tend to grow over time as data accumulates. A report that took 2 minutes last month might take 20 minutes now. Duration tracking catches this drift before the job starts timing out.
Example: Daily Report Monitoring
Here is a complete example of a monitored report generation job in Python:
import requests
from datetime import datetime, timedelta

REPORT_MONITOR_URL = os.environ.get('DAILY_REPORT_MONITOR_URL')
DELIVERY_MONITOR_URL = os.environ.get('REPORT_DELIVERY_MONITOR_URL')

def generate_daily_report():
    # Signal generation start
    try:
        requests.get(f'{REPORT_MONITOR_URL}/start', timeout=10)
    except:
        pass  # Don't fail the job if monitoring is down

    try:
        # Query data
        data = query_database()

        # Format report
        report = format_report(data)

        # Save report
        filename = f'daily_report_{datetime.now().strftime("%Y%m%d")}.pdf'
        save_report(report, filename)

        # Signal generation success
        try:
            requests.get(REPORT_MONITOR_URL, timeout=10)
        except:
            pass

        return filename

    except Exception as e:
        # Signal generation failure
        try:
            requests.get(f'{REPORT_MONITOR_URL}/fail', timeout=10)
        except:
            pass
        raise

def deliver_daily_report(filename):
    # Signal delivery start
    try:
        requests.get(f'{DELIVERY_MONITOR_URL}/start', timeout=10)
    except:
        pass

    try:
        recipients = get_report_recipients()
        send_email(
            to=recipients,
            subject=f'Daily Report - {datetime.now().strftime("%Y-%m-%d")}',
            attachment=filename
        )

        # Signal delivery success
        try:
            requests.get(DELIVERY_MONITOR_URL, timeout=10)
        except:
            pass

    except Exception as e:
        # Signal delivery failure
        try:
            requests.get(f'{DELIVERY_MONITOR_URL}/fail', timeout=10)
        except:
            pass
        raise

def run_daily_report():
    filename = generate_daily_report()
    deliver_daily_report(filename)
This example uses separate monitors for generation and delivery. If generation succeeds but delivery fails, you know exactly where the problem is.
Duration Tracking for Reports
Report duration is a leading indicator of trouble:
| Observation | Possible Cause |
|---|---|
| Gradual increase | Data growth; may need optimization |
| Sudden spike | Infrastructure issue; investigate immediately |
| High variability | Resource contention; consider dedicated resources |
| Sudden decrease | Missing data; report may be incomplete |
Set up duration alerts when jobs exceed their expected range. A report that normally takes 5-10 minutes but suddenly runs for 45 minutes deserves investigation, even if it eventually completes.
Grace Periods for Variable Reports
Different reports have different duration profiles:
| Report Type | Typical Duration | Suggested Grace Period |
|---|---|---|
| Simple summary | 1-5 minutes | 15 minutes |
| Data export | 5-30 minutes | 1 hour |
| Complex analytics | 10-60 minutes | 2 hours |
| Large data warehouse query | 30-120 minutes | 4 hours |
Err on the side of generous grace periods to avoid false alarms. A grace period that is too tight causes alert fatigue. A grace period that is too loose means delayed notification, but you still get notified.
Notification Strategy
Route report failure alerts appropriately:
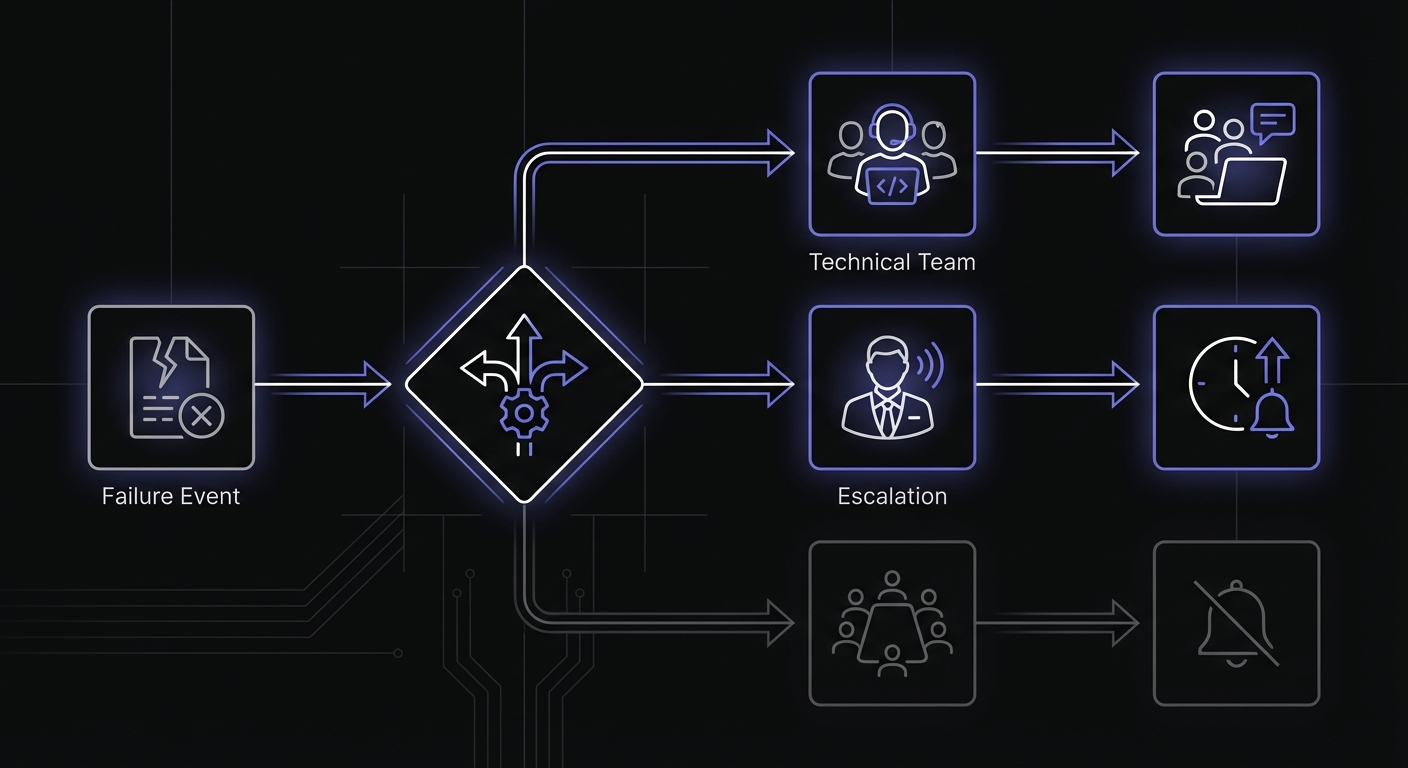
Alert the data team, not everyone: The people who can fix the problem should get the alert. Stakeholders should not receive technical failure notifications.
Do not alert stakeholders about technical issues: Instead of telling executives their report failed to generate, have the data team fix it and send manually. Alert stakeholders only when there will be a significant delay.
Have a communication plan for delays: When a report will be late, proactively notify recipients rather than waiting for them to ask. A quick email saying "Daily report is delayed, expect it by 11 AM" sets expectations.
Self-Healing Patterns
Build resilience into your report jobs:
Retry on transient failures: Network blips, temporary database locks, and similar issues often resolve on retry. Implement automatic retries with backoff.
from tenacity import retry, stop_after_attempt, wait_exponential

@retry(stop=stop_after_attempt(3), wait=wait_exponential(multiplier=1, max=60))
def query_database():
    # Retries up to 3 times with exponential backoff
    return db.execute(query)
Cache intermediate results: If your report queries multiple data sources, cache successful queries so a failure in one does not require starting over.
Send partial reports vs nothing: Sometimes a partial report is better than no report. If one section fails, consider sending what succeeded with a note about the missing section.
Troubleshooting Report Failures
When a report job fails, follow a systematic debugging approach:
Check logs first: Most report failures leave traces in application logs. Look for database connection errors, memory allocation failures, or timeout exceptions.
Verify data sources: Run the underlying queries manually. A query that worked last month might time out now due to data growth.
Check resource availability: Disk space for exports, memory for in-memory processing, and network connectivity to external APIs.
Review recent changes: Did someone modify the query, change database credentials, or update dependencies?
Common failure patterns by symptom:
| Symptom | Likely Cause | First Check |
|---|---|---|
| Job never starts | Scheduler misconfiguration | Crontab syntax, timezone settings |
| Hangs indefinitely | Database lock or slow query | Active queries, table locks |
| Crashes mid-execution | Memory exhaustion | Process memory limits, data volume |
| Completes but empty | Missing data or filter issue | Source data availability |
| Completes but not delivered | Email/delivery failure | SMTP logs, file permissions |
Setting Up Your Monitors
For each report job, configure:
- Generation monitor: Schedule matching the job, appropriate grace period
- Delivery monitor: If separate from generation
- Duration tracking: Alert on significant deviation from normal
- Alert channels: Email to data team, escalation for persistent failures
Example configuration for a daily executive report:
| Setting | Value |
|---|---|
| Schedule | Daily at 6:00 AM |
| Grace period | 2 hours |
| Expected duration | 15-30 minutes |
| Alert channels | Email to data team |
| Escalation | Slack if unresolved after 1 hour |
Implementation Checklist
Setting up report monitoring takes about 1-2 hours per report job. Follow this checklist:
For each report job:
- Create a monitor with schedule matching the job
- Set grace period based on typical duration plus buffer
- Configure start and completion pings in your code
- Set up failure notifications to the data team
- Document expected duration range for future reference
For your monitoring system:
- Choose notification channels (email, Slack, SMS for critical)
- Define escalation rules for prolonged outages
- Create a runbook for common failure scenarios
- Test alerts by triggering a deliberate failure
Ongoing maintenance:
- Review duration trends monthly
- Update grace periods as data volumes change
- Audit alert routing when team members change
Conclusion
Scheduled reports are invisible when they work and conspicuously absent when they fail. Stakeholders depend on timely data without understanding the complexity behind generation. When reports fail, decisions suffer.
Monitor both report generation and delivery. Track duration to catch performance degradation before jobs start failing. Set up alerts that reach the people who can fix problems, not the people waiting for reports.
The investment in report monitoring pays off in reliability. Stakeholders learn to trust that their reports will arrive. The data team catches issues before executives start asking questions. Small businesses with limited resources should also review our cron monitoring guide for small businesses for cost-effective strategies.
Cron Crew makes report monitoring straightforward. Create monitors for your report jobs, configure appropriate grace periods, and receive alerts when generation or delivery fails. Start monitoring your reports today and ensure your team always has the data they need.